At the end of 2018, inpEV counted on 83 collaborators, 79 of which were direct employees and 4 outsourced, a 2% reduction when compared to 2017, when the Institute had 85 collaborators. They are concentrated in the Southeast region (76%) and are divided in 40% women and 60% men. Last year all collaborators were covered by collective bargaining agreements.
Collaborators by working hours and gender
| Full time | Part-time | |
|---|---|---|
| Male | 50 | 0 |
| Female | 29 | 4 |
| Total | 79 | 4 |
| 83 | ||
Collaborators per type of labor contract and gender
| Indefinite period | Fixed period | |
|---|---|---|
| Male | 48 | 2 |
| Female | 31 | 2 |
| Total | 79 | 4 |
| 83 | ||
60% of collaborators are men and 40% are women
Collaborators per type of labor contract and region
| Indefinite period | Fixed period | |
|---|---|---|
| South | 6 | 0 |
| Southeast | 59 | 4 |
| Midwest | 9 | 0 |
| Northeast | 5 | 0 |
| North | 0 | 0 |
| Total | 79 | 4 |
| 83 | ||
Collaborators by functional level and gender
| Male | Female | |
|---|---|---|
| Directors | 1 | 0 |
| Managers | 5 | 4 |
| Leaders/coordinators | 11 | 8 |
| Technicians/supervisors | 3 | 1 |
| Administrative | 7 | 12 |
| Operational | 19 | 3 |
| Apprentices | 2 | 1 |
| Interns | 1 | 1 |
| Third-party | 1 | 3 |
| Total | 50 | 33 |
| 83 | ||
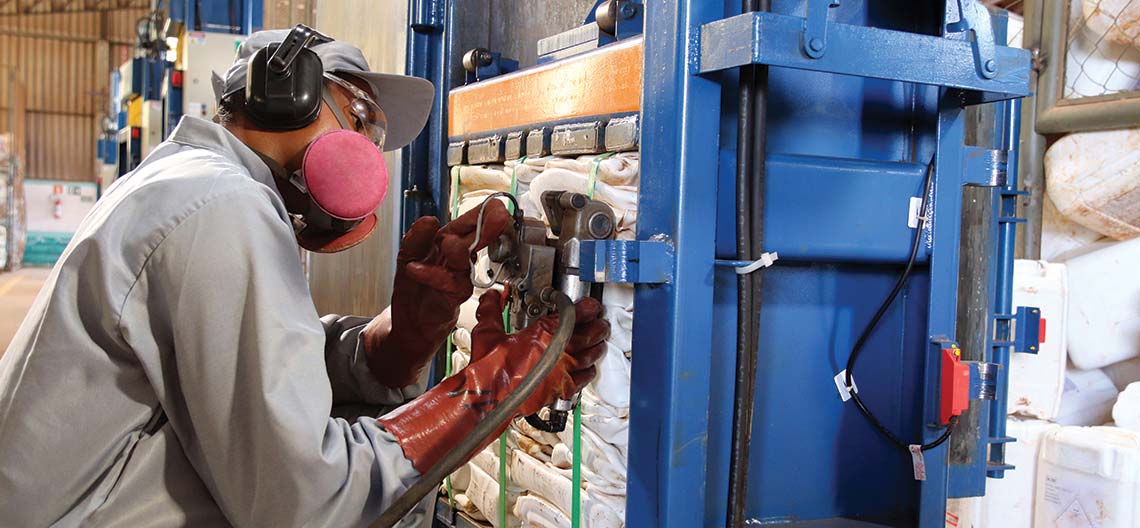
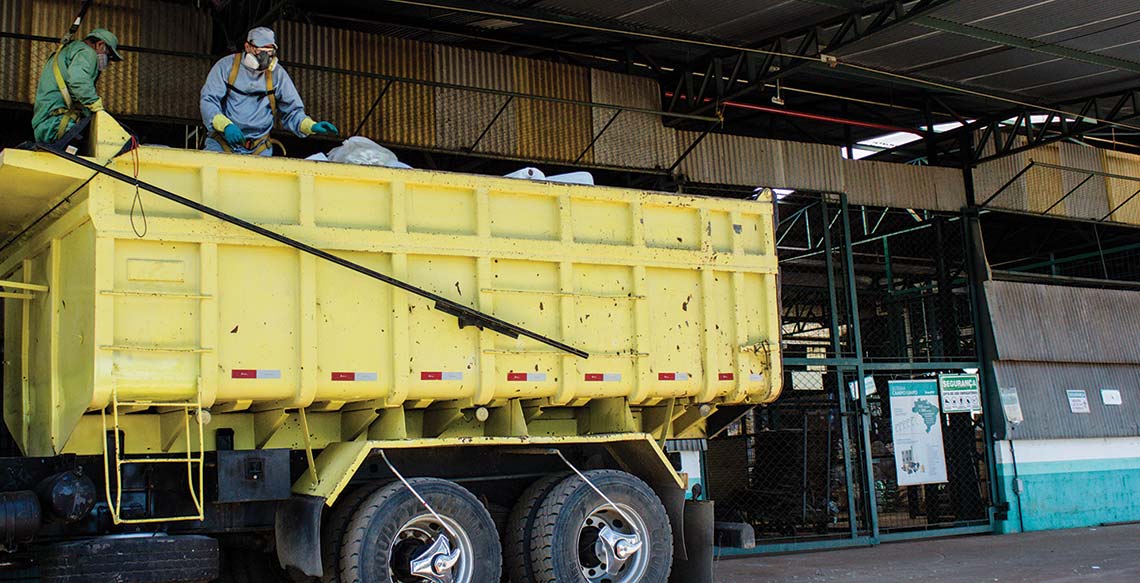
Health and safety 403-2 416-1
By having safety as one of its values, the care for people has always been a priority for inpEV, which makes efforts to incorporate more and more a safety culture in the daily lives of all those involved with the Campo Limpo System.
This is why the Institute has invested in developing its Health and Safety Management System in 2018, which seeks to standardize some processes and procedures, identify the risks in different activities, improve working conditions and maintain a good environment with adequate facilities and quality equipment.
With an attentive attitude and by intensifying health and safety actions and encouraging all units to adopt better practices, it is possible to achieve important results. This is how inpEV significantly improved its health and safety indicators in 2018, when compared to the preceding year. The injury rate, for example, dropped 20%, while the lost time rate dropped 68%.
Health and safety rates *
| 2016** | 2017 | 2018 | |||||
|---|---|---|---|---|---|---|---|
| Total | Male | Female | Total | Male | Female | Total | |
| Injury rate | N/D | 22.50 | 0.00 | 12.20 | 15.40 | 0.00 | 9.79 |
| Occupational illnesses rate | N/D | 0.00 | 0.00 | 0.00 | 0.00 | 0.00 | 0.00 |
| Lost days rate | N/D | 112.50 | 0.00 | 61.20 | 30.81 | 0.00 | 19.59 |
| Absenteeism rate | N/D | 0.00 | 0.00 | 0.00 | 1.21 | 0.02 | 1.92 |
| Number of deaths | 0 | 0 | 0 | 0 | 0 | 0 | 0 |
Training and development 404-1
InpEV remains committed and attentive to the constant improvement of its staff, by providing training every year that offers growth opportunities to collaborators and improves internal processes, both at its headquarters and at the central stations under its direct management.
In 2018, 1,200 hours of training were offered to our headquarter employees, an average of 14.52 hours per collaborator - in 2017, this average was 15.34 hours.
For receiving station employees, inpEV mainly offered training related to work safety and operational procedures in 2018. Around 1,200 hours of training were offered to these collaborators, representing an average of 34.66 hours per collaborator - in 2017, this average was 13.93. The variation in training between these years was due to new training needs identified in 2018 and syllabus increase for routine training courses.
Average training hours at headquarters, per functional category and gender
| Number of collaborators | Number of training hours provided | Average hours of training | |
|---|---|---|---|
| Functional category | |||
| Directors | 1 | 0.00 | 0.00 |
| Managers | 9 | 172.00 | 19.11 |
| Coordinators | 19 | 408.00 | 21.47 |
| Supervisors | 4 | 0.00 | 0.00 |
| Administrative | 22 | 529.00 | 24.05 |
| Operational | 23 | 6 | 0.26 |
| Apprentices | 3 | 32.00 | 10.67 |
| Interns | 2 | 58.00 | 29.00 |
| Total | 83 | 1,205.00 | 14.52 |
| Gender | |||
| Male | 50 | 525.00 | 10.50 |
| Female | 33 | 680.00 | 20.61 |
| Total | 83 | 1,205.00 | 14.52 |
Average training hours at receiving stations under direct management, by functional category and gender
| Number of collaborators | Number of training hours provided | Average hours of training | |
|---|---|---|---|
| Functional category | |||
| Administrative | 3 | 99.00 | 33.00 |
| Apprentices | 1 | 13.00 | 13.00 |
| Housekeeping staff | 3 | 37.00 | 12.33 |
| Operational | 19 | 786.00 | 41.37 |
| Operational leaders | 3 | 156.00 | 52.00 |
| Supervisors | 6 | 122.00 | 20.33 |
| Total | 35 | 1,213.00 | 34.66 |
| Gender | |||
| Male | 28 | 1,110.00 | 39.64 |
| Female | 7 | 103.00 | 14.71 |
| Total | 35 | 1,213.00 | 34.66 |