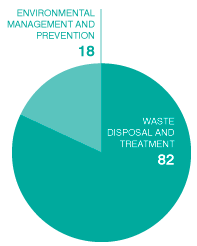
In 2014, the Institute invested almost R$ 19 million in environmental protection, a 25% growth over 2013. Most of this value (82.3%) corresponds to costs arising from waste treatment and disposal, and 17.3% to incineration of unwashed packages, which could not be returned to the productive cycle (see chart below). G4-EN31
Considering the administrative headquarters, in São Paulo, and the Rondonópolis receiving unit, water consumption increased 16% totaling 983.7m3. The total volume was supplied by local water concessionaires (see graph).
G4-EN8
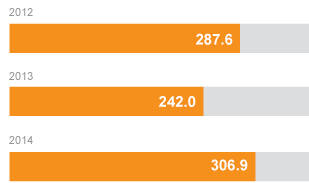
Electric power consumption increased 26% and reached 306 GJ. Automotive gasoline consumed throughout the year was equivalent to 16.12 GJ. All energy consumed is from indirect sources, acquired from power concessionaires. G4-EN3
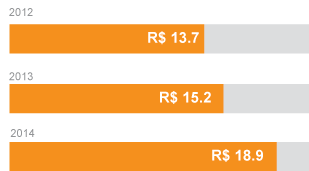
18.9 million reais were invested by inpEV in environmental protection
Investments in environmental protection (r$ x1000)
| 2012 | 2013 | 2014 | |
|---|---|---|---|
| Waste treatment and disposal | 10,738 | 11,926 | 15,607 |
| Incineration of unwashed packagings | 6,940 | 8,342 | 11,072 |
| Disposal of improper and obsolete products* | 3,091 | 2,825 | 4,270 |
| Destination of illegal products | 300 | 425 | 265 |
| Disposal of bags, seeds and sanitary products (pilot projects) | 407 | 334 | 0 |
| Environmental management and prevention | 2,997 | 3,229 | 3,347 |
| Awareness and educational actions** | 2,859 | 3,090 | 3,145 |
| Monitoring actions*** | 138 | 139 | 202 |
| Total | 13,735 | 15,155 | 18,954 |
Note: there are no expenses with the treatment of atmospheric emissions and remediations
* Programs developed with the states of São Paulo and Paraná.
**Includes the investments in awareness and education, such as events like the National Clean Field Day, Clean Field Environmental Education Program, materials produced for use in Field Days and presentations, besides materials used by multipliers.
*** The numbers reflect the monitoring actions, after the empty packages have been washed by farmers, with water and soil quality analyses, besides related consultancies.
2014 environmental protection (%) G4-EN31
Environmental protection (R$ million) G4-EN31
Energy consumption (GJ) G4-EN3
Water consumption (m3)*
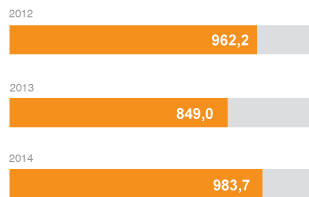
Note: the consumption calculation includes the administrative headquarters and the Rondonópolis (MT) receiving unit. Even though directly managed by inpEV, it was not possible to individualize consumption for the Taubaté (SP) unit, since it is within the same area as the Campo Limpo Plastics Transformation and Recycling.
* Water consumption at the administrative headquarters is estimated based on the unit's participation percentage in terms of total consumption of the condominium where it is located.